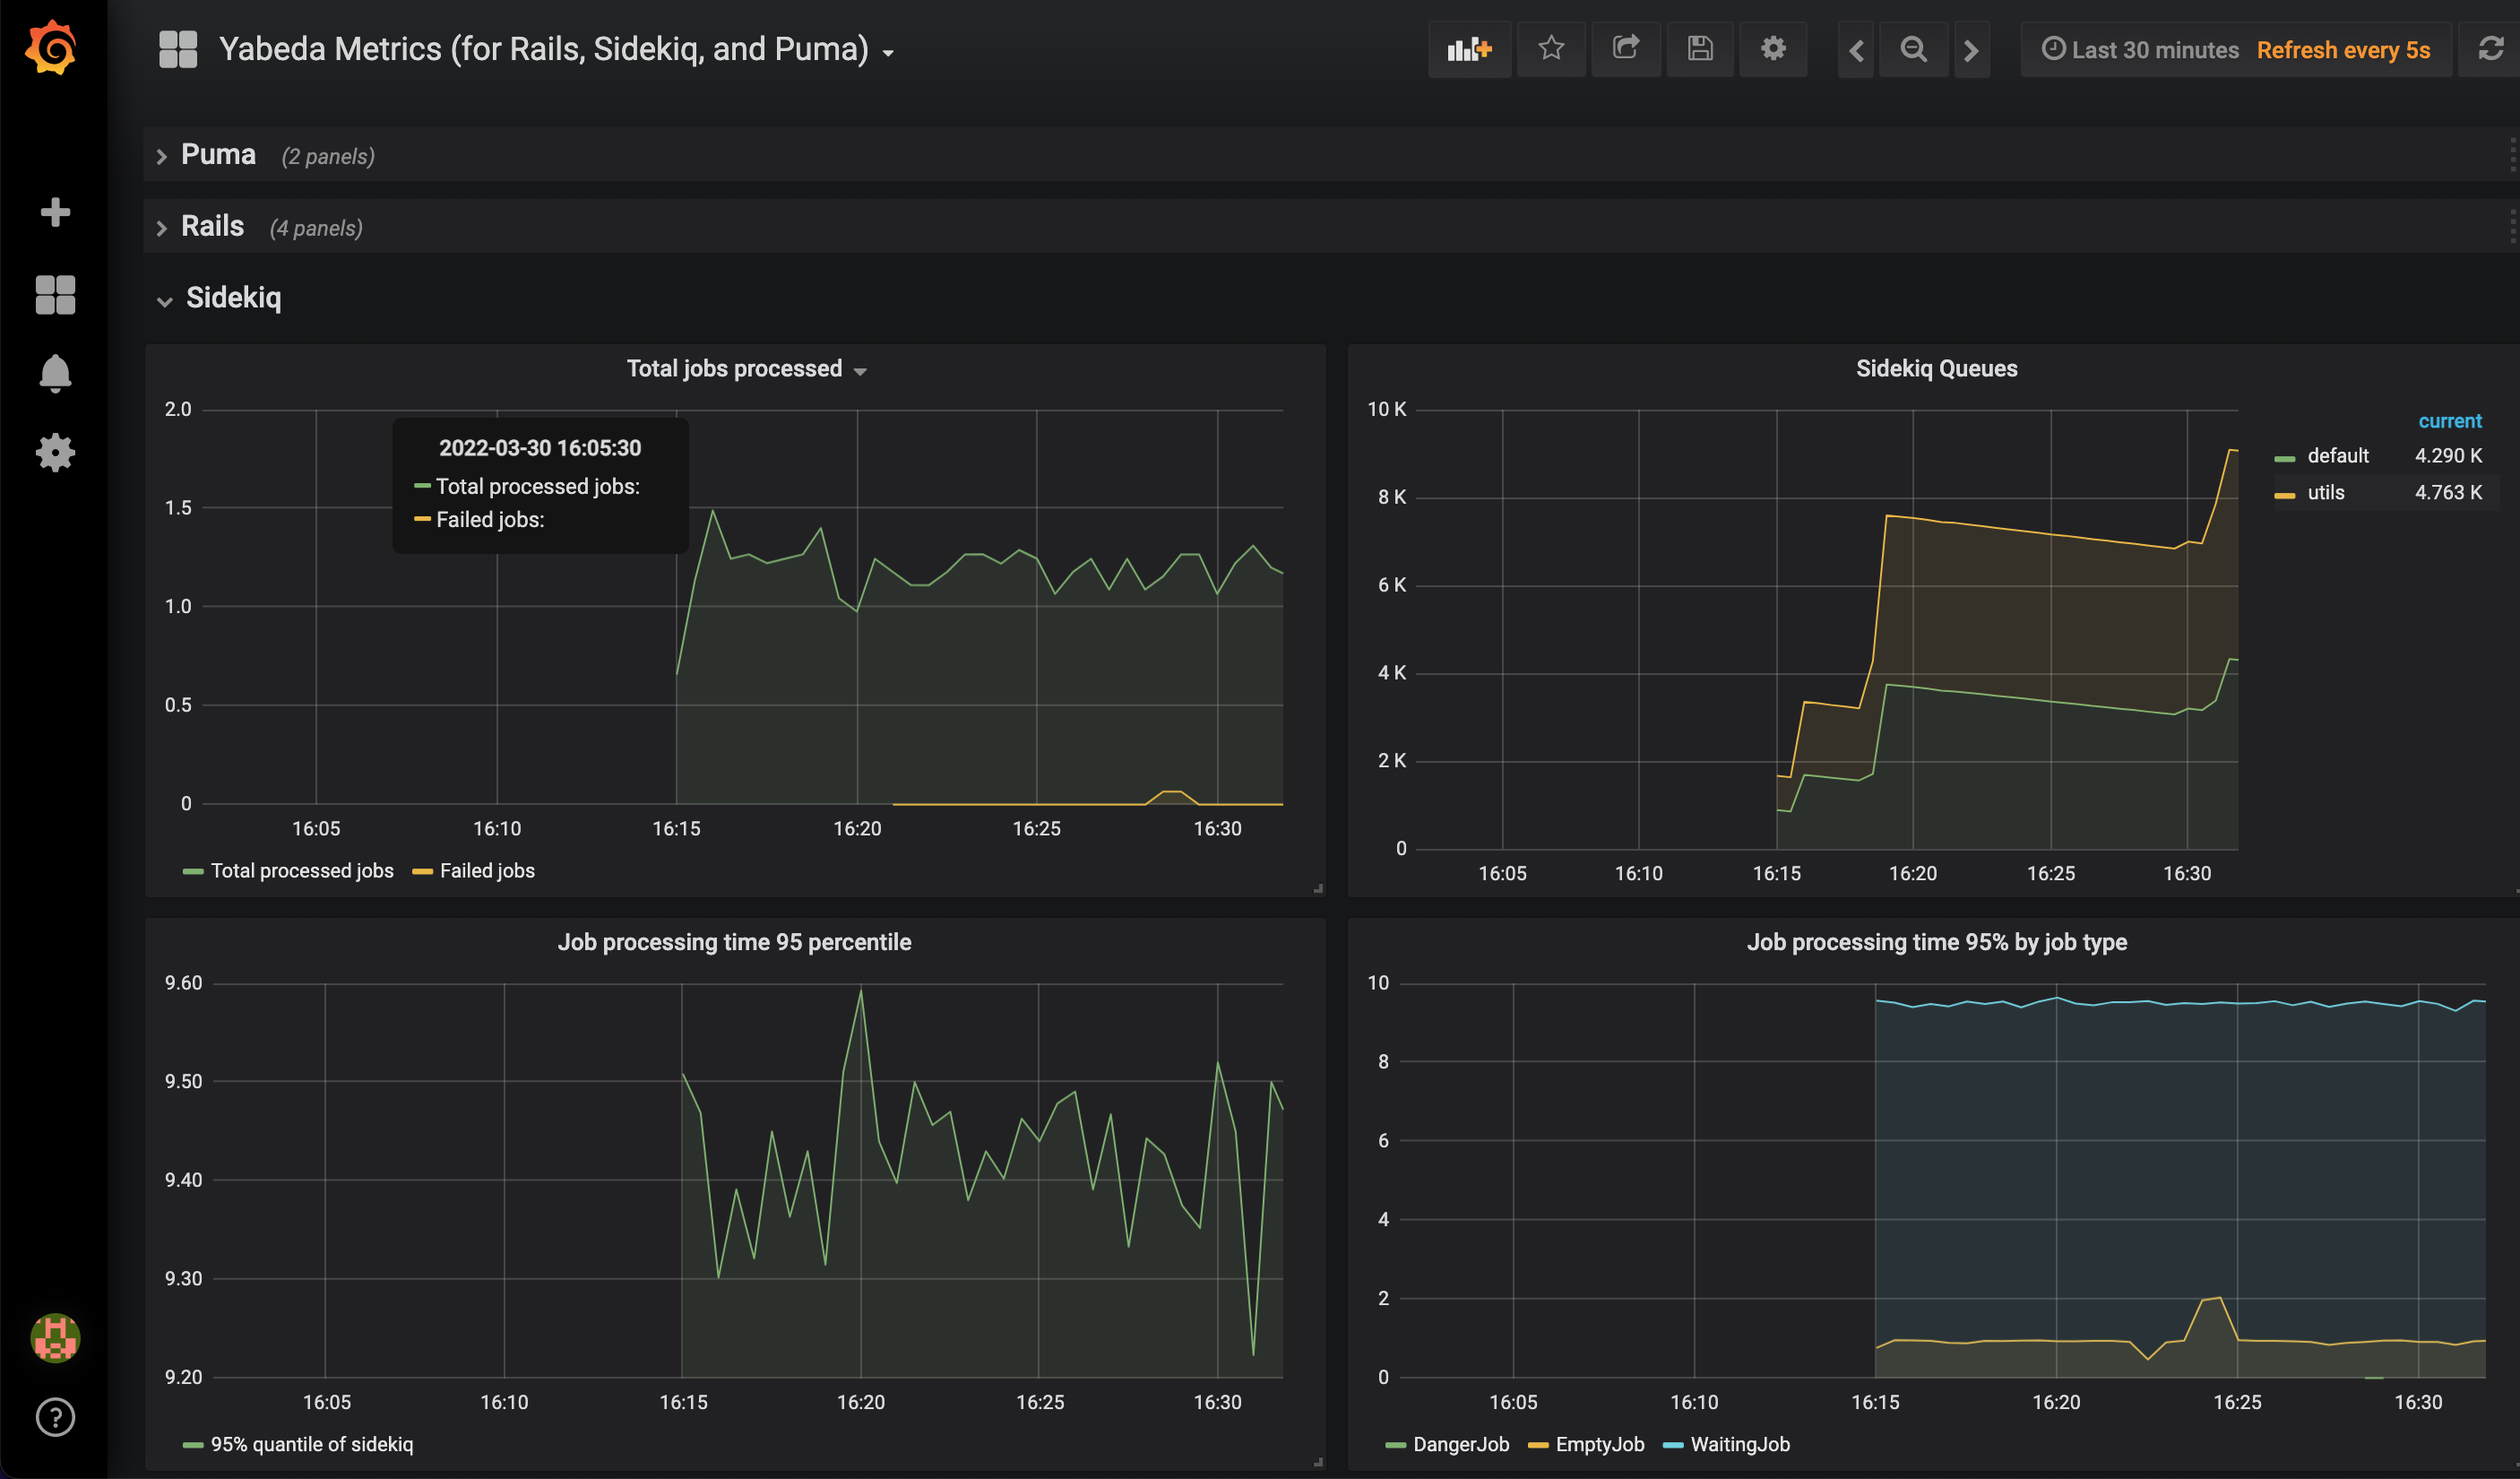
Performance monitoring plays an important role in finding bottlenecks in application. Grafana, Prometheus and InfluxDB are the most popular tools for monitoring. This tutorial illustrates how to use Grafana, Prometheus and InfluxDB to monitor the performance of your Rails application.
Recently, we were exploring open source alternatives to NewRelic and Datadog for performance monitoring. We came up with a solution that uses Prometheus and InfluxDB along with Grafana to monitor the performance of your Rails application.
Listing down functions of each of these below.
- Prometheus: Log and export application metrics in time series using Prometheus.
- Influx DB: Use InfluxDB to store time series metrics exported by Prometheus.
- Grafana: Use Grafana to visualize the metrics stored in InfluxDB.
Step 1: Setup Prometheus to log metrics
We will be using Yabeda Prometheus gem/adapter to expose metrics collected Yabeda plugins to Prometheus.
To setup, add yabeda-prometheus gem to Gemfile.
gem 'yabeda-prometheus'
Perform bundle install.
bundle install
Now, enable yabeda prometheus exporter in your application by adding the following to your config.ru file.
use Yabeda::Prometheus::Exporter
Adding the entire config.ru file for illustration below.
# This file is used by Rack-based servers to start the application.
require ::File.expand_path('../config/environment', __FILE__)
use Yabeda::Prometheus::Exporter
run Rails.application
Once, this is done, we need to start prometheus exporter server. Create an initializer file in config/initializers directory.
# config/initializers/yabeda_prometheus.rb

unless Rails.env.development? || Rails.env.test?
  Yabeda::Prometheus::Exporter.start_metrics_server!
end
We have enabled prometheus exporter if environment is not test or development
Now, prometheus logs metrics on /metrics URL. Please find a few sample metrics log lines below.
rails_requests_total{controller="api/v1/product",action="index",status="200",format="html",method="get"} 3.0
rails_requests_total{controller="api/v1/categories",action="index",status="200",format="json",method="get"} 3.0
rails_requests_total{controller="api/v1/users",action="show",status="200",format="html",method="get"} 55.0
rails_requests_total{controller="api/v1/categories",action="show",status="200",format="json",method="get"} 31.0
1.1 Collect Rails metrics
We can collect basic rails metrics using a gem yabeda-rails.
Just add the gem yabeda-rails to Gemfile.
# Gemfile
gem 'yabeda-rails'
The metrics that are collected are:
- Total web requests received: rails_requests_total
- Web request duration: rails_request_duration (in seconds)
- Views rendering duration: rails_view_runtime (in seconds)
- DB request duration: rails_db_runtime (in seconds)
Perform bundle install and restart the server. In the later step, we will be using these metrics to plot graphs in grafana.
1.2 Collect Puma metrics
We can collect puma server metrics using a gem yabeda-puma-plugin.
Add the gem yabeda-puma-plugin to Gemfile.
# Gemfile
gem 'yabeda-puma-plugin'
Perform bundle install. Add following two lines in config/puma.rb file.
# config/puma.rb
activate_control_app
plugin :yabeda
Please refer Readme of the gem to understand advanced options of configuration.
1.3 Collect Sidekiq metrics
We can collect sidekiq worker metrics using a gem yabeda-sidekiq.
Add the gem yabeda-sidekiq to Gemfile.
# Gemfile
gem 'yabeda-sidekiq'
Perform bundle install.
Add following lines in the sidekiq initializer file.
# config/initializers/sidekiq or elsewhere
Sidekiq.configure_server do |_config|
  Yabeda::Prometheus::Exporter.start_metrics_server!
end
Please refer Readme of the gem to understand advanced options of configuration.
Step 2: Setup Influx DB
Influx DB is a time series database. It stores time series data in a relational database. The logs exported by Prometheus will be stored in Influx DB.
2.1 Install Influx DB on Mac OS
We can install install influx DB on Mac OS using Homebrew.
brew install influxdb
This will install latest stable version of influx DB on your Mac. Please follow setup instructions to install Influx DB based on the host.
2.2 Configure influx DB with Rails
To use influx DB with Rails, we will use influxdb-rails gem. This will configure Ruby on Rails application to store metrics exported by Prometheus.
Add the gem influxdb-rails gem to Gemfile
gem 'influxdb-rails'
Perform bundle install. Once done, run the following generator to create initializer file.
bundle exec rails generate influxdb
This will create an initiliazer file in config/initializers directory.
# config/initializers/influxdb_rails.rb
InfluxDB::Rails.configure do |config|
  config.client.database = ENV['INFLUX_DB_NAME']
  config.client.hosts = ['localhost']
  config.client.port = 8086
  config.ignored_environments << 'development'
end
Here is the sample configuration file of influx DB.
Please modify values of database name, hosts, port and ignored_environments
to match your configuration.
Step 3: Setup Grafana
Grafana is an open source web application for monitoring and visualizing metrics. It can be used to show graphs, charts based on data sources connected.
In our use case, we will add InfluxDB as a data source to the Grafana. Then, build graphs based on time series data reported by prometheus for Rails metrics, Puma Metrics and Sidekiq Metrics as discussed in the previous steps.
3.1 Install Grafana
To install grafana on Mac OS using homebrew, use the command given below.
brew install grafana
Follow grafana setup instructions for other operating systems.
Once installed, start the grafana with the following command.
brew services start grafana
This will start grafana on 3000 port. Now, you can open grafana using the following URL.
http://localhost:3000
This shows a login page for Grafana web application.
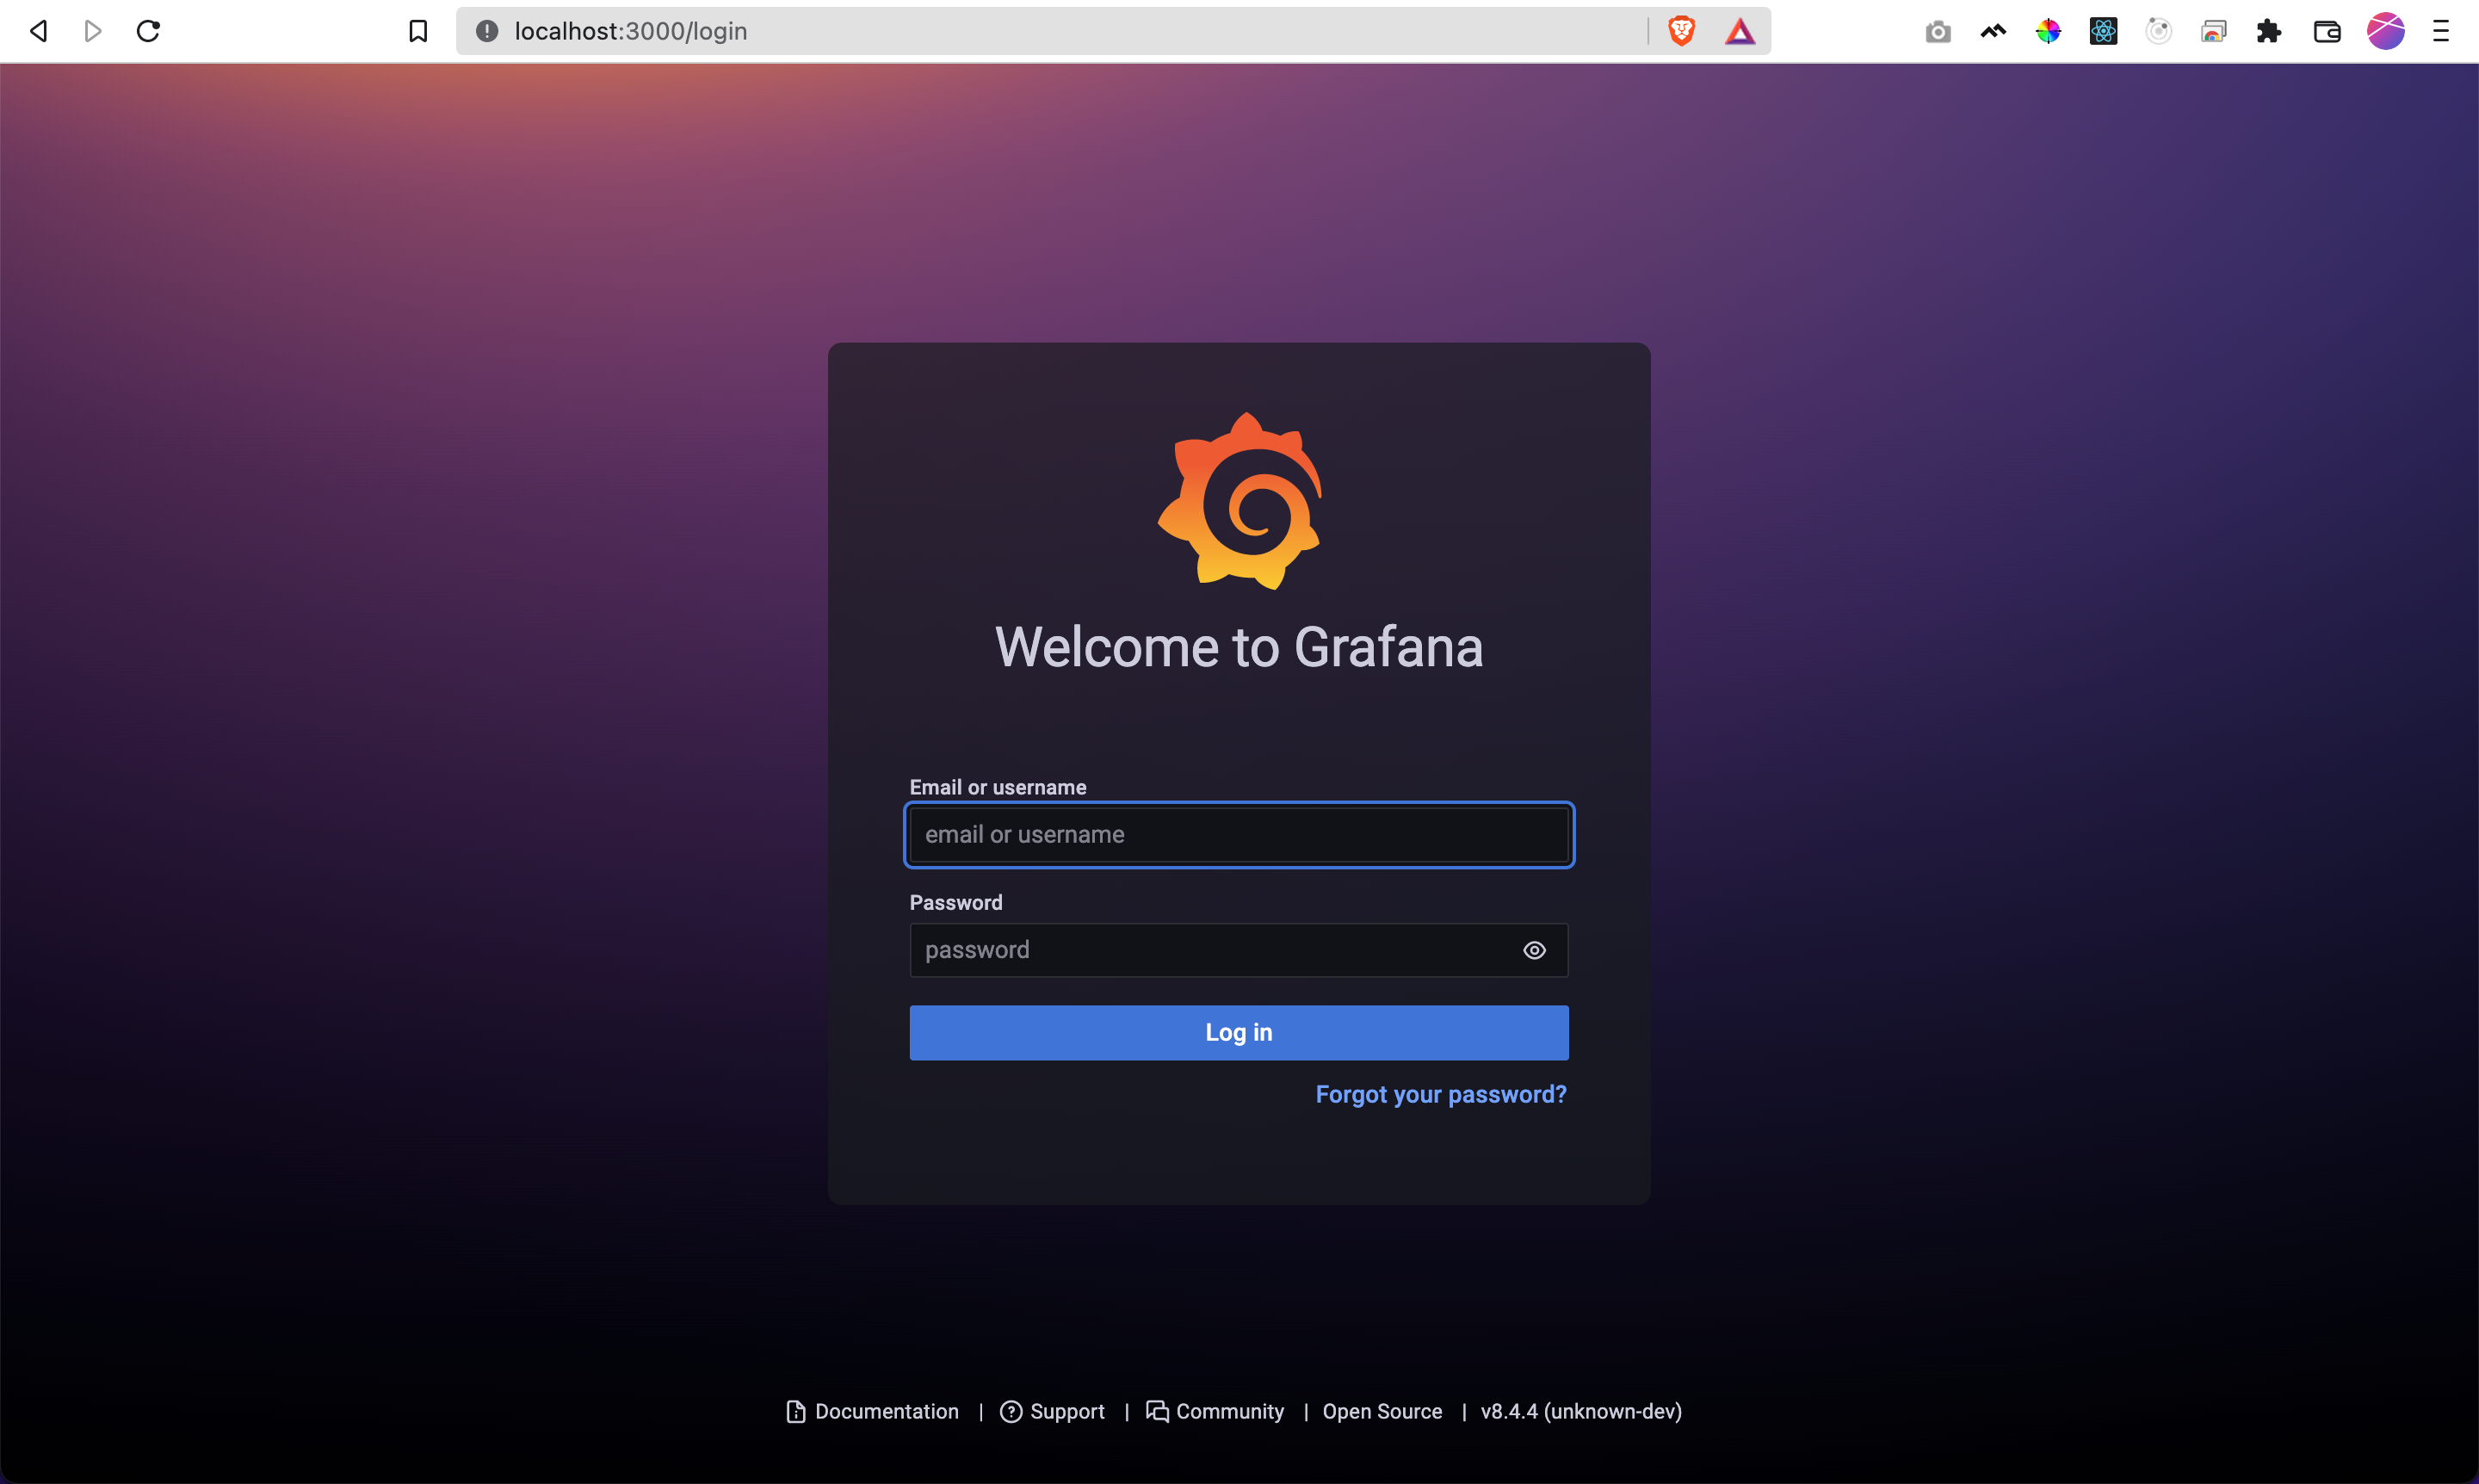
Login to grafana with the following credentials.
username: admin
password: admin
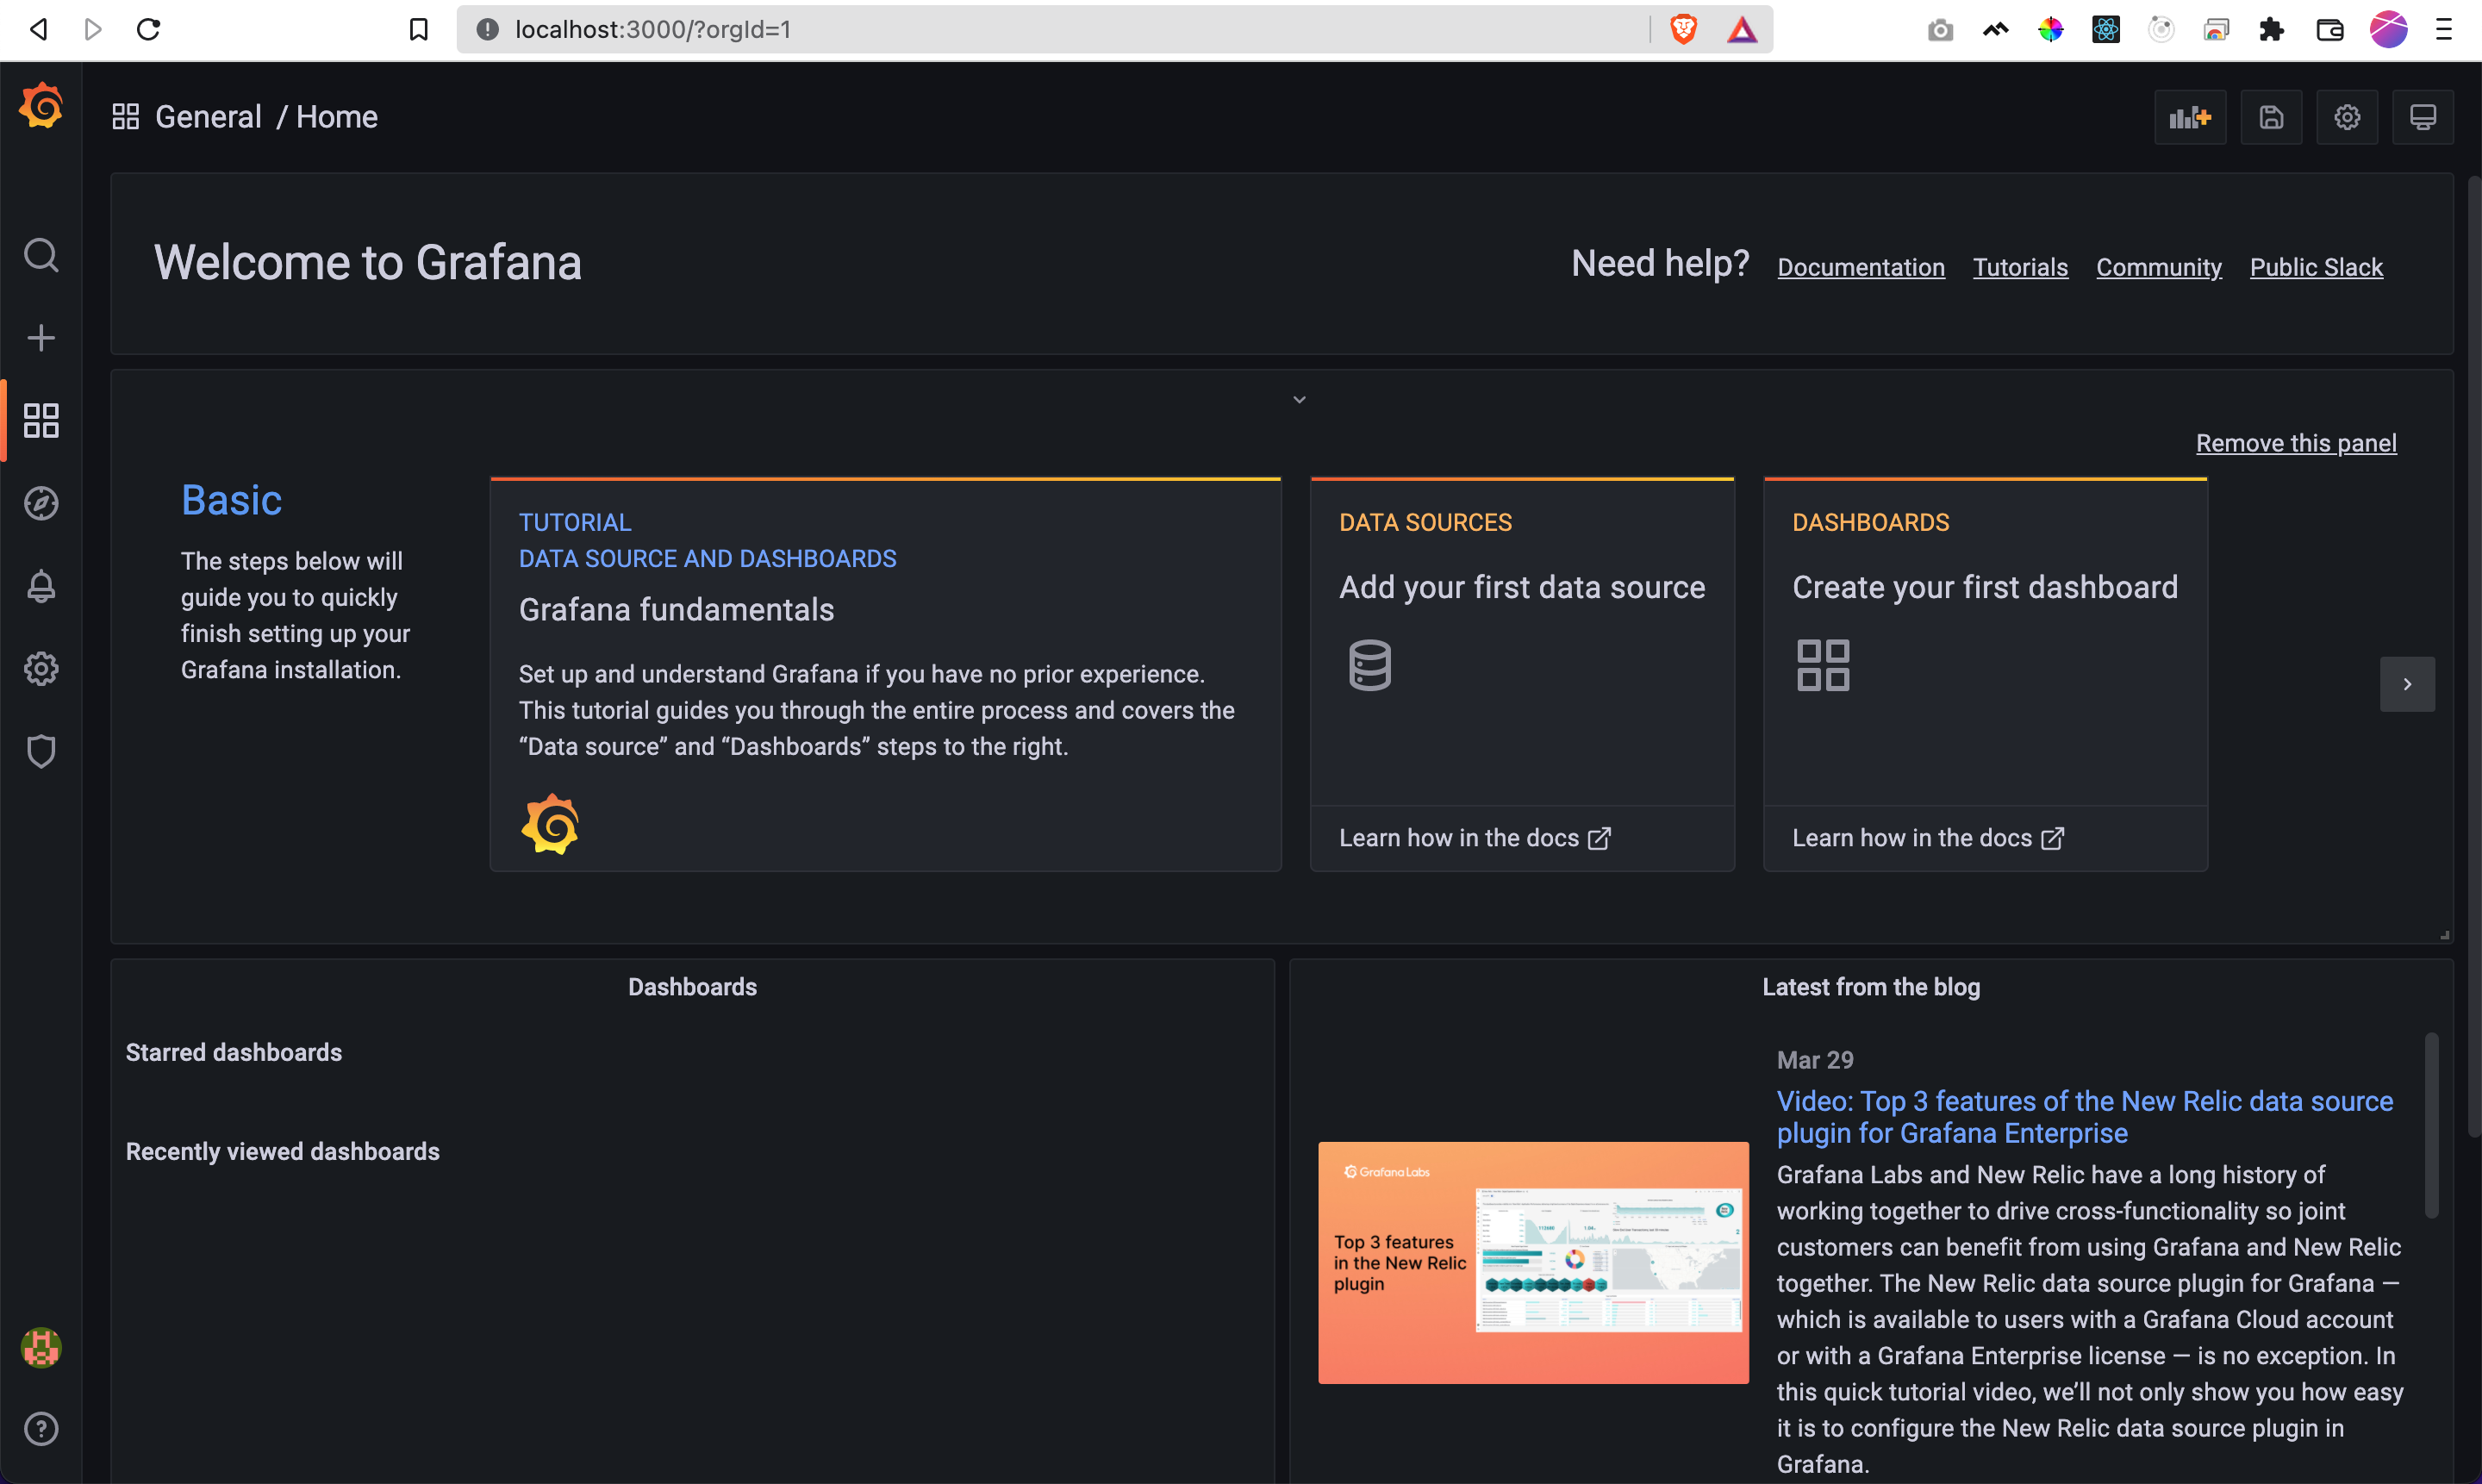
Once logged in, a dashboard will be shown as given below.
3.2 Create grafana dashboard for Rails
Since, we have configured Prometheus to collect metrics for Rails, Influx DB to store metrics, we can configure grafana dashboard based on these metrics.
Influx DB Rails provies a variety of sample dashboard templates that can be used with your Rails application.
- Ruby On Rails Performance
- Ruby On Rails Performance per Action
- Ruby On Rails Performance per Request
- Ruby On Rails Requests
- Ruby On Rails Slowlog by Action
- Ruby On Rails Slowlog by Request
- Ruby On Rails Slowlog by SQL
- Ruby On Rails ActiveJob
In addition, there are multiple grafana dashboard configurations available on Grafana Dashboars page.
Listing down a few of them.
Pick a dashboard that suits your needs, and download JSON configuration of the dashboard.
Next, go to grafana and click on + icon and select Create Dashboard button in the left sidebar.
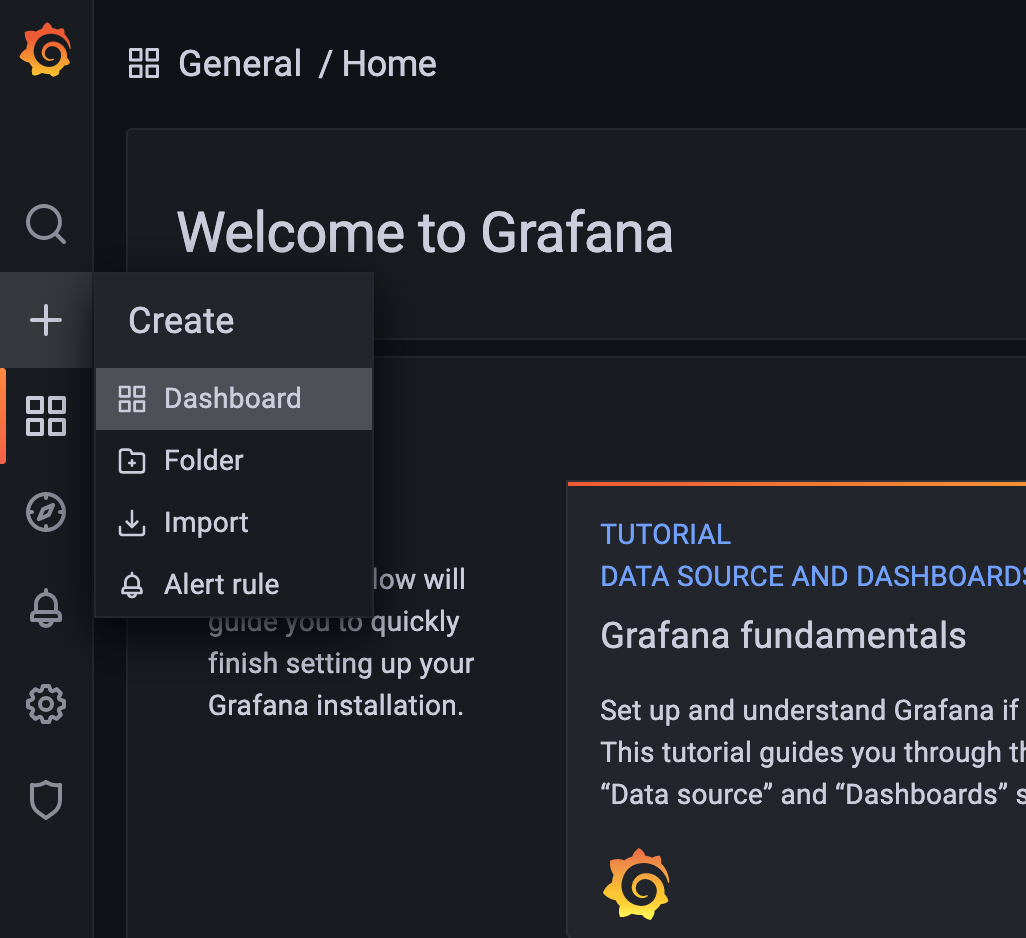
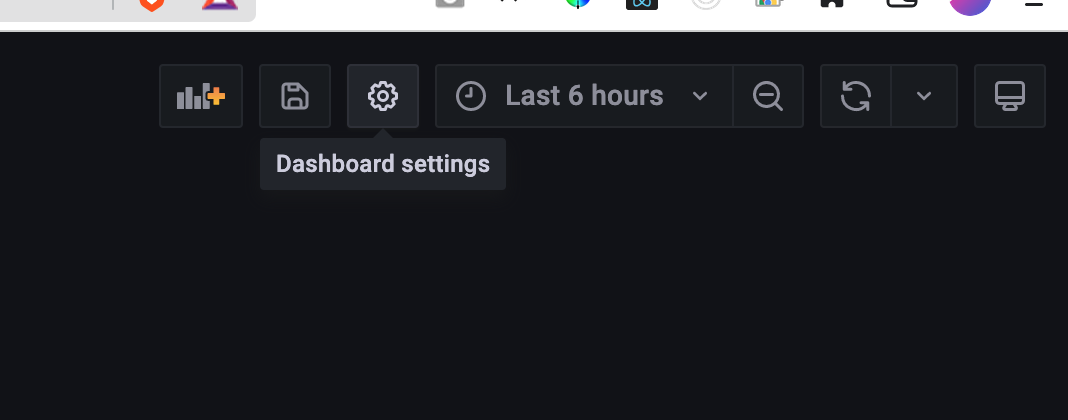
For the new dashboard, click on Dashboard Settings icon in the header.
Click on JSON Model option in the left sidebar as given in the image below.
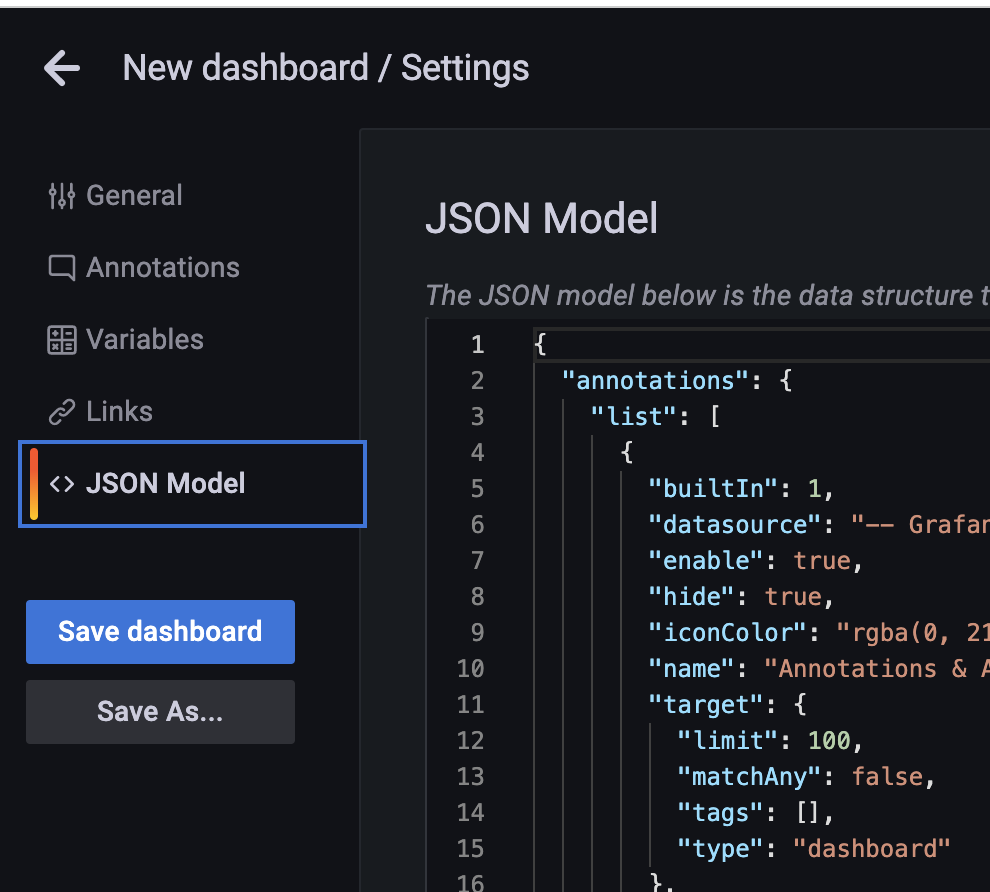
Now, post the JSON obtained from the step given above and save the dashboard. This will create a grafana dashboard based on the JSON configuration file used.
Make sure to modify data sources in the JSON file as needed.
Demo grafana dashboard: show graphs / charts for various metrics.
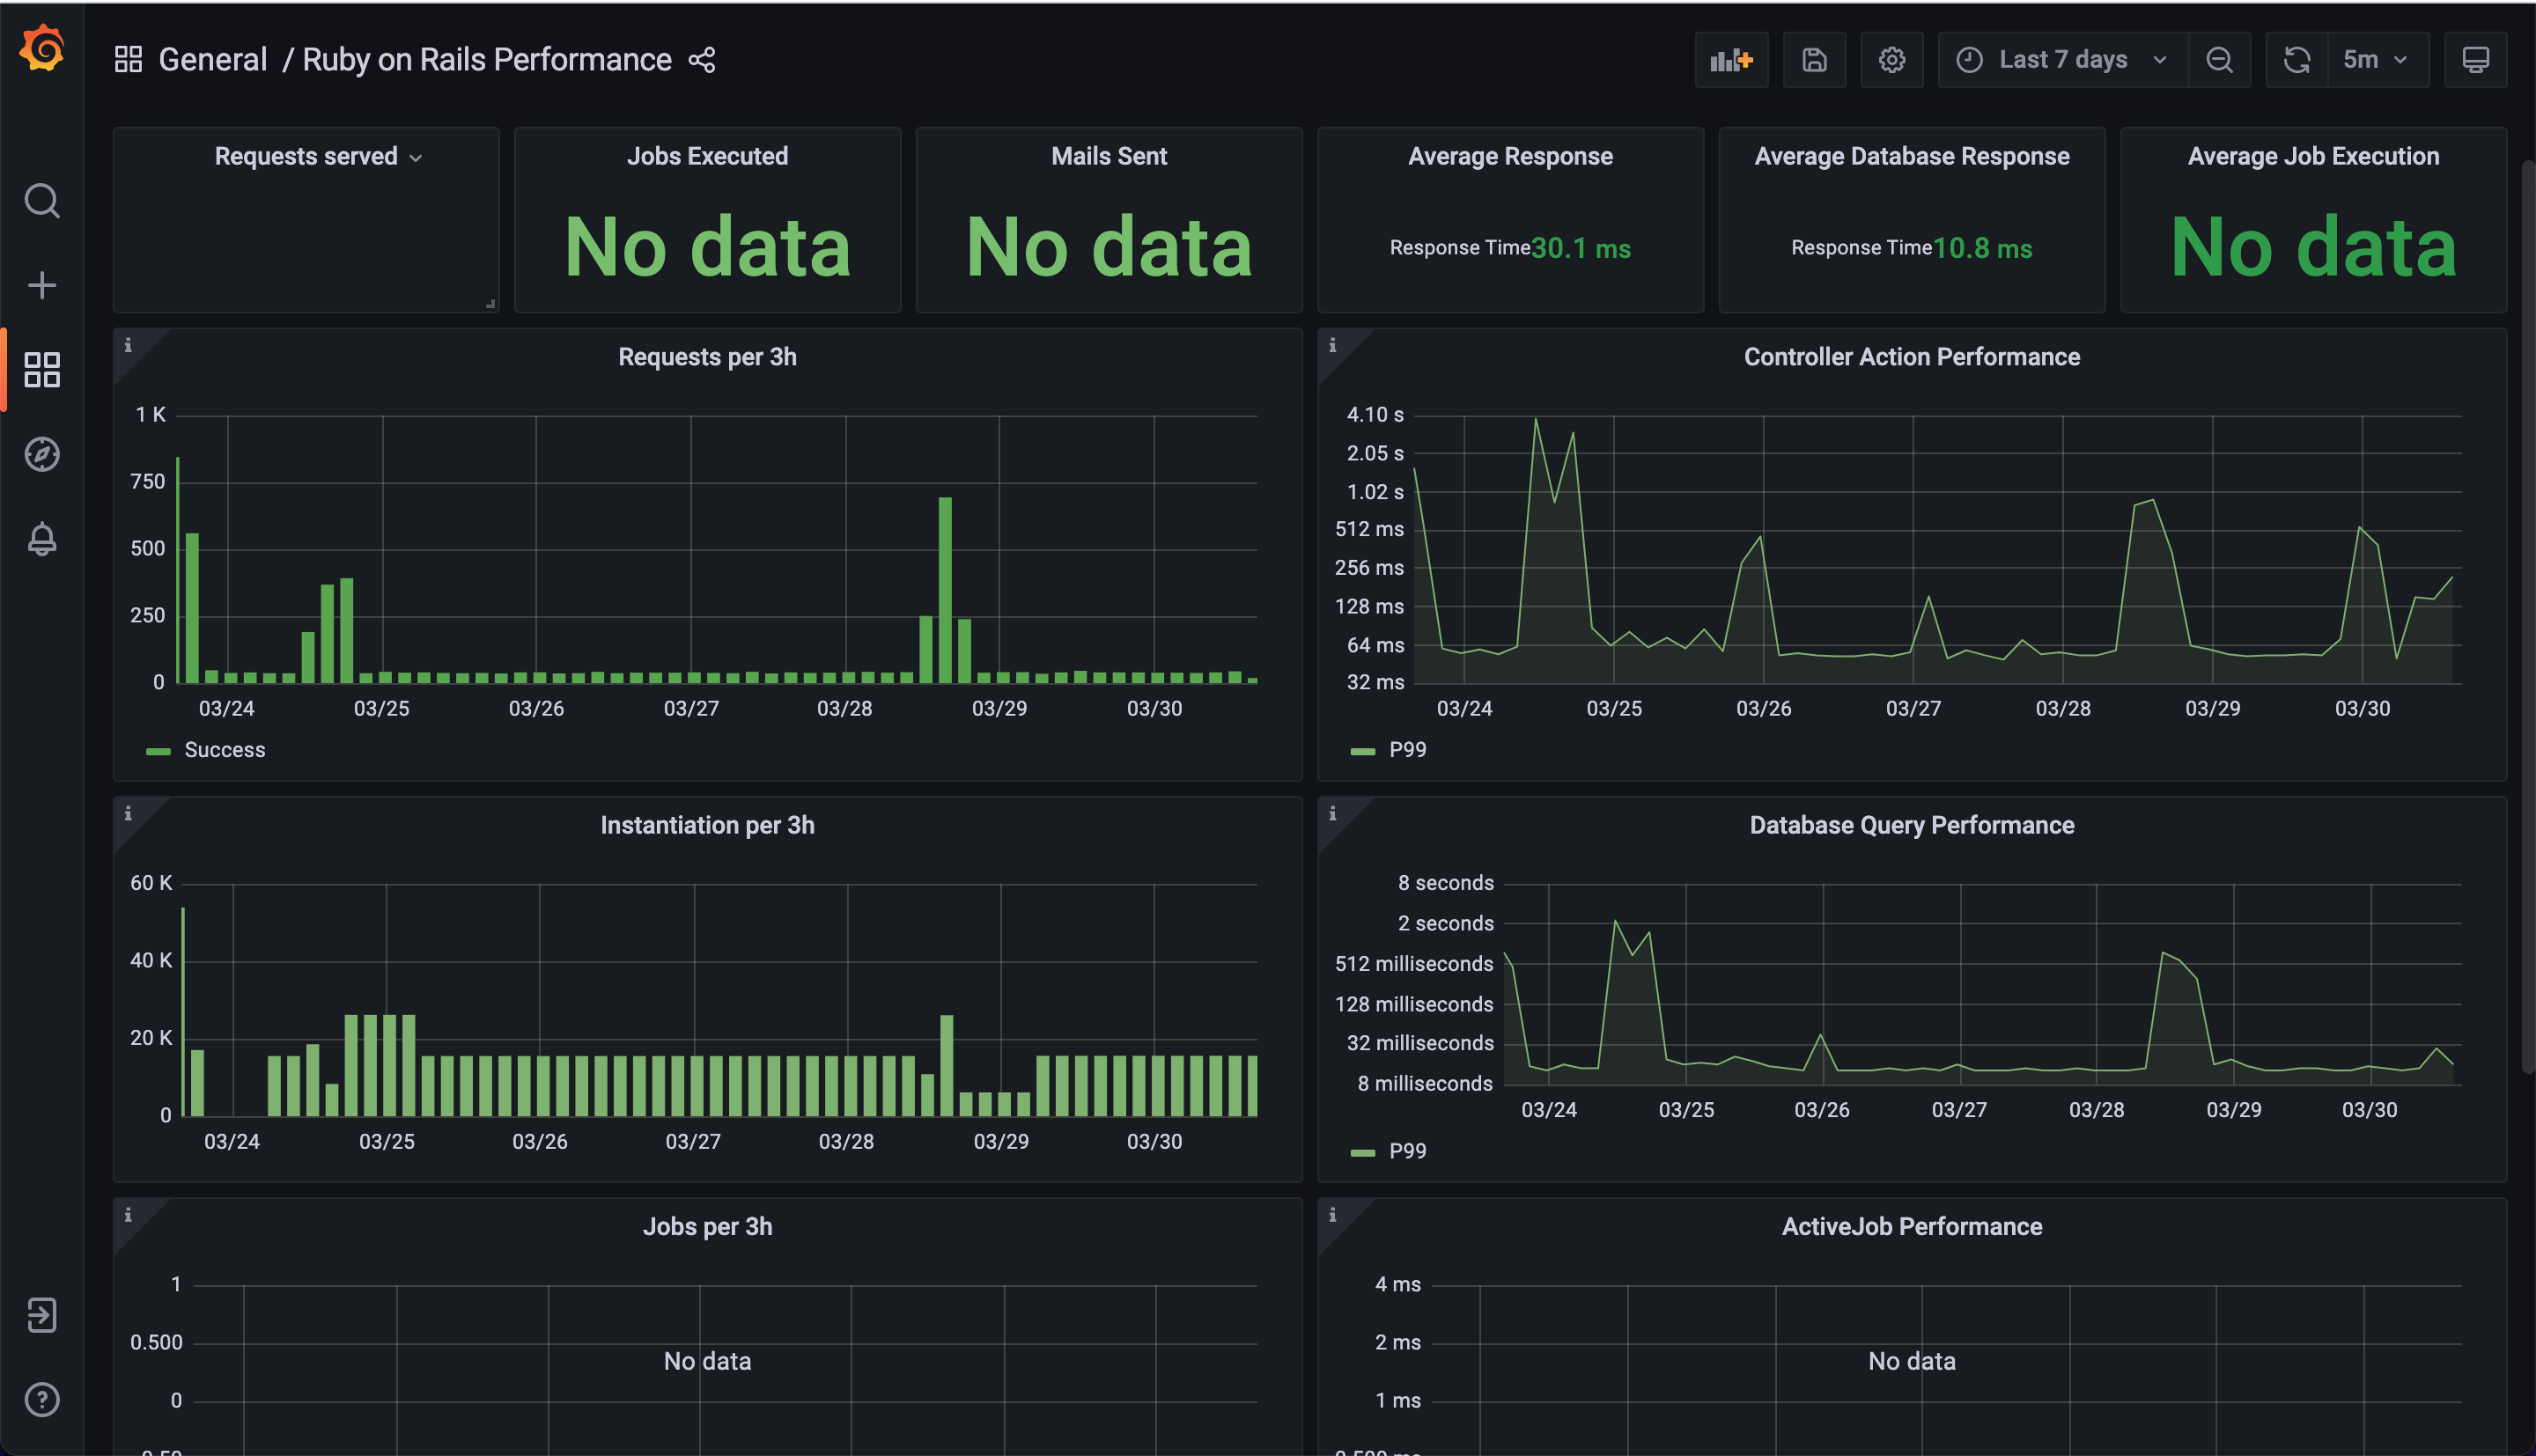
If you are having difficulties integrating grafana dashboard based on the steps discussed above, please refer to next step which is a sample Rails application with Grafana dashboard bundled in a docker app.
Step 4: Demo Grafana Dashboard showing Rails performance metrics
Yabeda has developed an example prometheus
- Ruby on Rails application with Grafana dashboard showing Puma, Sidekiq and Rails metrics. The application is dockerised so that you can readily try it out to see how it works on the local environment.
Pre-requisite for running the application is to have Docker installed on your system.
Please check out repository and perform setup instructions to run the application.
git clone git@github.com:yabeda-rb/example-prometheus.git
cd example-prometheus
docker-compose up
Head over to http://localhost:5000 to see the demo Rails application. Head over to http://localhost:3000 to see the demo grafana dashboard showing metrics from Rails application.
Posting a screenshot of the grafana dashboard for this demo application below.
